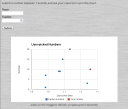
 here is a working example of a google form and chart embedded statically into a web page.
you may also be interested in a truly static version and/or the underlying data in this spreadsheet on google docs.
submit a number between 1 and 20, and see your input turn up in the chart.