 the problem
i have two sets of data for one graph, and use two different data point symbols. to make the graph more intuitive, i’d like to add the symbols to the axis labels, e.g.
• percent loss of conductivity (%)
° stomatal conductance (%)
the addition of the correct symbol is apparently easy using legend(), but i want to add it directly to the axis label.
the solution
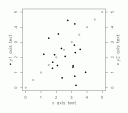
when plotting my data, i disable the automatic creation of axis labels (… xlab =””, ylab=””, …) and add my own label text later. in order to use symbols (bullet points and circles in my case; also applies to other symbols1), i eventually resorted to a combination of text(), Hershey Vector Fonts and graphical parameters such as cex (character expansion, for bigger font size), adj (string align) srt (string rotation) and xpd (plot/clipping adjustment).
code example:
par(mar=c(5,5,2,5))


# create data and plot circles

x <- seq(0,5,0.5)
y <- seq(0,5,0.5)
plot(x,y, xlab="", ylab="")

#create random data and add bullets (pch=19)
x <- rnorm(20,2.5)
y <- rnorm(20,2.5)
points(x,y, pch=19)

#add y axis on right side
axis (side = 4)

#create text with symbols
text(-1,2.5,"\\#H0850 y1 axis text", vfont=c("sans serif","plain"), cex=1.25, adj=0.5, srt=90, xpd=TRUE)
text(6,2.5,"\\#H0902 y2 axis text", vfont=c("sans serif","plain"), cex=1.25, adj=0.5, srt=90, xpd=TRUE)
text(2.5,-1,"x axis text", vfont=c("sans serif","plain"), cex=1.25, adj=0.5, srt=0, xpd=TRUE)
for further information, refer to the manual: R: Hershey Vector Fonts in R.
for lists of hershey vector font codes, have a look at the R Graph Gallery.
limitations
unfortunately, there are a few limitations to this approach: hershey code is (for now) only interpreted within the text() function, not with xlab, ylab or mtext().
also, if you're creating a multi-graph plot with mfrow or mfcol, text is usually clipped at the margins of each individual graph. this means, that if your axis label text is too long, it will be clipped at the beginning and end. a line-break will probably omit that, but that doesn't seem to be a clean solution.
(some of the information via)
- e.g. special characters, mathematical operators, cyrillic letters or greek letters – though there are easier ways for the latter. [↩]
Nice idea!
I suggest to check out the function intToUtf8 that can directly generate text codes for unicode symbols that can then be used by the text-function
intToUtf8(9800:9900)
plot(1,1,lwd=0)
text(1,1,intToUtf8(9800))